JVM Pauses - It's more than GC
May 28, 2020
Background
Everyone knows and loves the good-ol’ JVM GC pause. New GC algorithms have been introduced to improve GC latencies or prevent the need to pause altogether. However, that’s not the end of the story for JVM pauses. Unfortunately, there are a variety of other housekeeping tasks within the JVM that can force it to stop executing user code1.
Safepoint Operations
First, it is important to understand the concept of a safepoint within the JVM. A safepoint is a point in program execution where the state of the program is known and can be examined. Things like registers, memory, etc. For the JVM to completely pause and run tasks (such as GC), all threads must come to a safepoint.
For example, to retrieve a stack trace on a thread we must come to a
safepoint. This also means tools like jstack require that all threads
of the program be able to reach a safepoint.
To be more precise about what exactly a safepoint is, we refer to the HotSpot Glossary which defines a safepoint as:
A point during program execution at which all GC roots are known and all heap object contents are consistent. From a global point of view, all threads must block at a safepoint before the GC can run. (As a special case, threads running JNI code can continue to run, because they use only handles. During a safepoint they must block instead of loading the contents of the handle.) From a local point of view, a safepoint is a distinguished point in a block of code where the executing thread may block for the GC. Most call sites qualify as safepoints. There are strong invariants which hold true at every safepoint, which may be disregarded at non-safepoints. Both compiled Java code and C/C++ code be optimized between safepoints, but less so across safepoints. The JIT compiler emits a GC map at each safepoint. C/C++ code in the VM uses stylized macro-based conventions (e.g., TRAPS) to mark potential safepoints.
While GC is one of the most common safepoint operations, there are many
VM operations2 that are run while threads are at safepoints. Some may
be invoked externally by connecting to the HotSpot JVM (i.e. jstack,
jcmd) while others are internal to the JVM operation (monitor
deflation, code deoptimization). A list of common operations is below.
- User Invoked:
- Deadlock detection
- JVMTI
- Thread Dumps
- Run at regular intervals (see
-XX:GuaranteedSafepointInterval3)- Monitor Deflation
- Inline Cache Cleaning
- Invocation Counter Delay
- Compiled Code Marking
- Other:
- Revoking Biased Locks
- Compiled method Deoptimization
- GC
All these operations force the JVM to come to a safepoint in order to run some kind of VM operation. Now we can decompose a safepoint operation times into two categories.

- Time taken from initiating the safepoint request until all threads reach a safepoint
- Time taken to perform safepoint operation.
You can view this behavior in a JVM by adding the
-XX:+PrintGCApplicationStoppedTime and -XX:+PrintGCDetails4 flags.
This will print messages to the GC logs that look like:
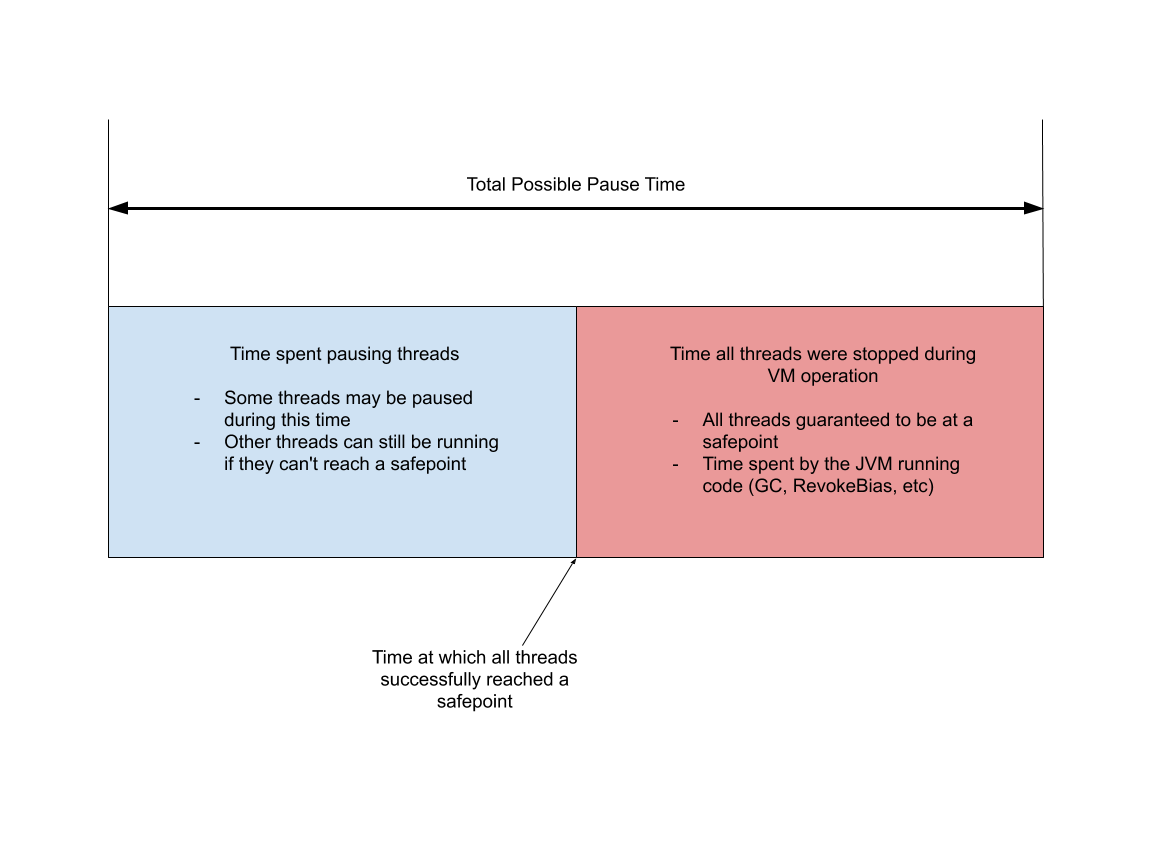
Total time for which application threads were stopped: 0.0572646 seconds, Stopping threads took: 0.0000088 seconds
The 0.0572646 seconds is the sum total time that threads may have been
stopped for. This includes the blue and red sections above. The
0.0000088 seconds is the time spent in the blue section, where it took
that much time to stop all threads at a safepoint. Even though the JVM
flag is named -XX:+PrintGCApplicationStoppedTime5 it actually logs
all JVM pauses, not just GC.
So, if applications are not responding, it may be because
- The JVM is trying to reach a safepoint and most threads have already stopped except maybe one or two, or
- The JVM has reached a safepoint and is running some internal operations. May it be GC, lock bias revocation, cache line invalidation, etc.
The issue is that we need to figure out exactly what is triggering the pause in the first place if anything, and then investigate which part of the pause is taking a long time; the time to get to the safepoint (TTSP), or the time spent performing the VM operation.
To do that more logging is required. The flags that need to be added to
the JVM are -XX:+PrintSafepointStatistics
-XX:PrintSafepointStatisticsCount=1. Adding these two arguments will
print to stdout or the configured log file every time a safepoint
operation occurs. As of JDK 8 the log output consists of two lines and
looks like the following (times are in ms):
  vmop [threads: total initially_running wait_to_block] [time: spin block sync cleanup vmop] page_trap_count
155623.484: RevokeBias [ 1595 0 0 ] [ 0 0 127 7 0 ]  0
Breaking down the output:
- 155623.484: The time in seconds since the JVM started
- RevokeBias (vmop): The VM operation running during this safepoint.
- 1595 (total): The total number of threads in the VM when the safepoint was requested
- 0 (initially running): The number of threads running at the beginning of the safepoint operation
- 0 (wait to block): The number of threads blocked when the VM began the operation execution
- 0 (spin): The time spent spinning waiting for threads to reach a safepoint
- 0 (block): The time spent waiting for threads to block for the safepoint
- 127 (sync): The total time spent synchronizing the threads for the safepoint. This is a combination of spin + block + “other activity”. This value is what I regard as the “time to safepoint” or TTSP. In the GC logs, the TTSP or “Time stopping threads” typically only includes the spin + block times based on my analysis.
- 7 (cleanup): Time spent on internal VM cleanup activities
- 0 (vmop): The time spent on the actual safepoint operation (RevokeBias). This can be any safepoint operation.
- 0 (page_trap_count): Page trap count
It’s important to reiterate that the spin, block, and sync times represent portions of the TTSP. So, if TTSP is large it can mean that one thread might be attempting to finish its work, while the rest of the JVM threads are paused waiting for it to reach a safepoint. This is why the total pause time of a JVM must be considered TTSP + cleanup + vmop.
With this information we can handily take any JVM logs and figure out which operations were running. It’s critical to consider both the safepoint logs and GC logs. Otherwise it’s possible to miss information about TTSP mentioned above.
Analyzing Safepoint Pauses
Now that we know all about safepoints and how to get their statistics, we need to know what can prevent Java threads from coming to a safepoint. Some of those causes are1:
- Large object initialization
- i.e. initializing a 10GB array. (Single threaded, zeroing the array)
- Array copying
- JNI Handle Allocation
- JNI Critical Regions
- Counted Loops
- NIO Mapped Byte Buffers
- Memory mapped portion of a file
Usually, if a program is taking a long time to reach a safepoint there is a systemic issue in the code where it performs one or more of the operations above for extended periods of time without allowing the JVM to come to a safepoint.
Fortunately, there are even more options that can be added to the JVM in order to enable logging when it takes a longer than expected time to reach a safepoint6.
-XX:+SafepointTimeout -XX:SafepointTimeoutDelay=<timeout in ms>
These two options print to the VM log / stdout all threads which have failed to reach a safepoint after the specified time period. This can help developers troubleshoot which threads might be causing extended pauses of the JVM and whether the root cause is the VM operation or the TTSP.
Next, we’ll do a real analysis on an example of a large TTSP and what the JVM and GC logs will look like. The data below was collected from a long running java server application.
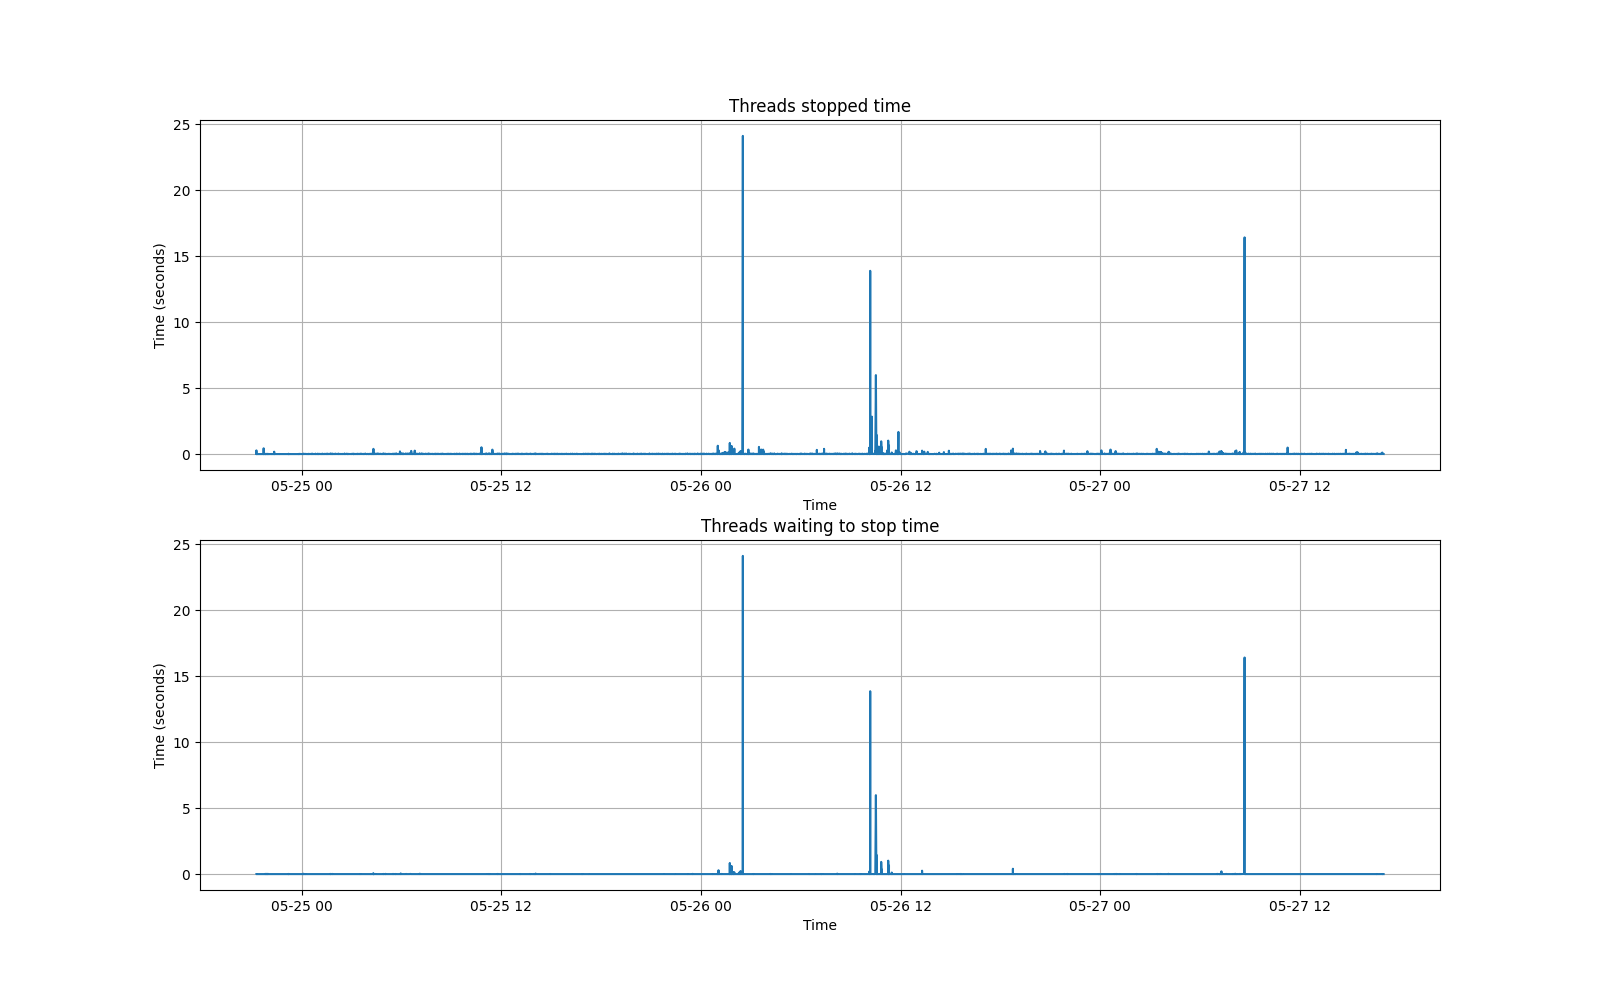
Take the following graph of a GC log from the “Time Application Threads were Stopped” and the “Time Stopping Application Threads”:

The graph above plots the GC log of a worker. It shows a few spikes with a max of ~24 seconds of pause time reported by the JVM. For each spike most of the thread pause time was actually spent stopping the threads, not performing the operations! Notice the correlation of spikes in “Threads waiting to stop” vs “Threads stopped time”. It’s clear something is amiss.
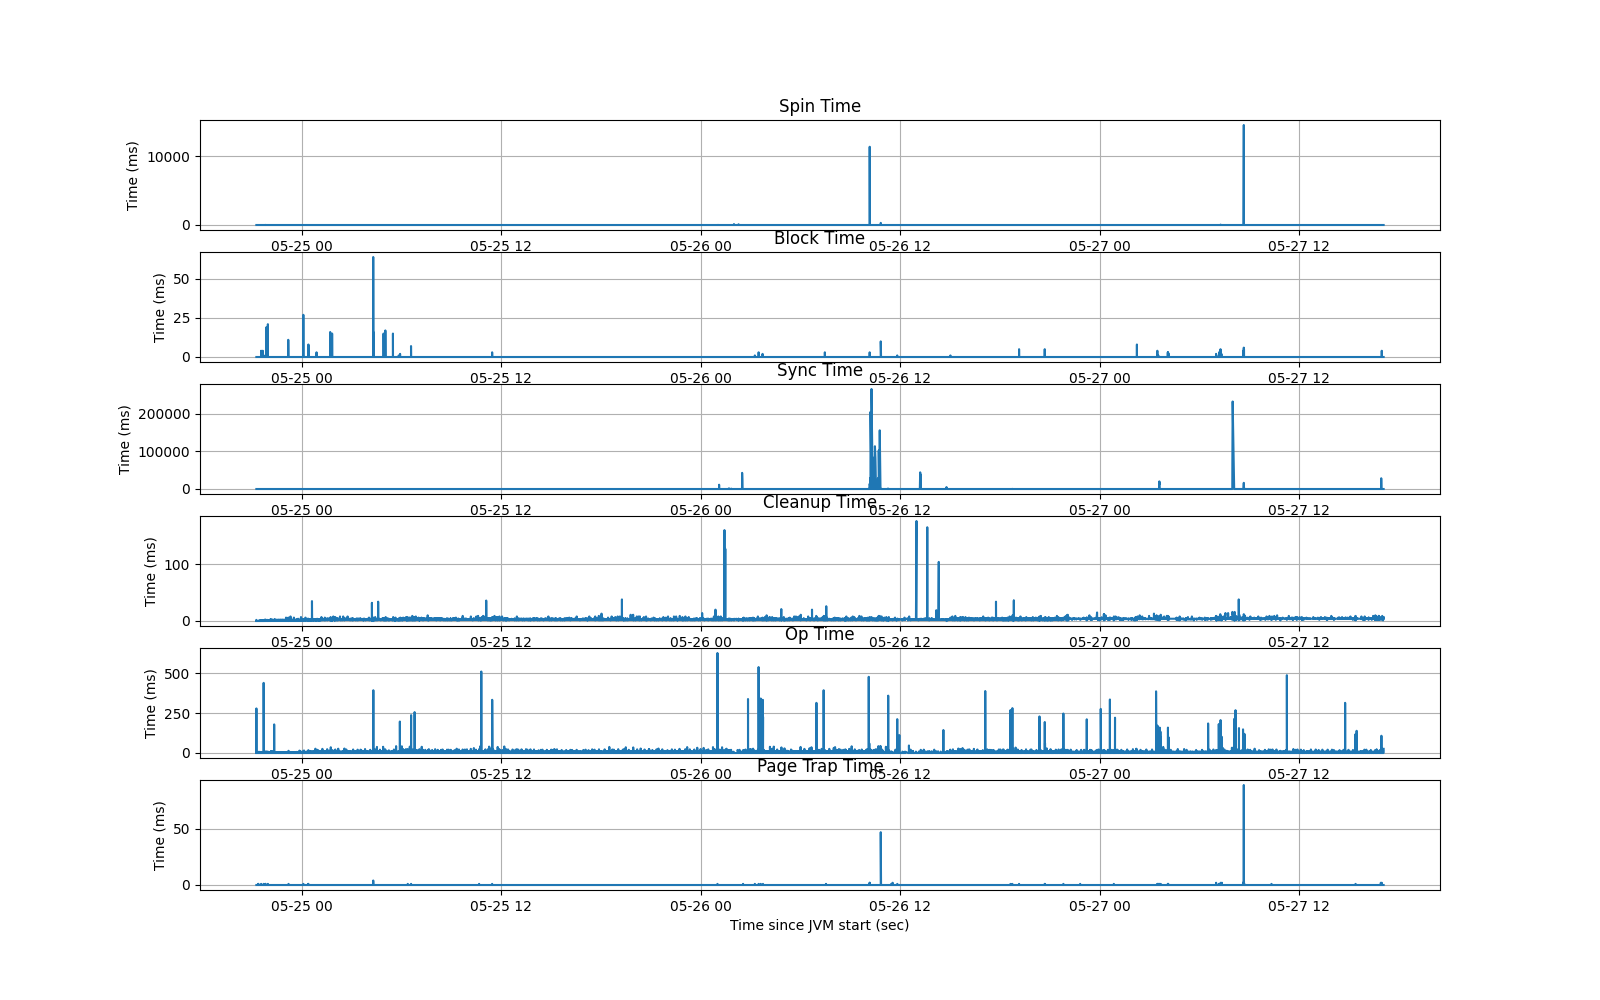
Now, let’s take a look at the safepoint statistics plotted on the same timeline. Each statistic is represented individually on its own graph.

This graph shows the times for each safepoint statistic. Remember the sync time is generally equal to the TTSP (spin + block + “other”), but compare the y-axis scale versus the graph above.
This graph shows spikes correlated at the exact same times as some of the GC pauses on the graph above, and even more frequently than as reported by the GC log output. Additionally, the GC pause times reported peaked at a measly 24s. The values for this graph (under the “sync” operation) show spikes of over 200000ms, or nearly 5 minutes. Notice that the graph for “Op Time” (vmop) has a scale of only 500ms meaning many of the actual VM operations were short-lived.
These graphs show that the “Time Stopping Application Threads” reported in GC logs should not always be trusted. The safepoint statistics are more fine grained, but provide more information about how the application behaves. The reason we didn’t catch issues in the application initially is because the GC log wasn’t providing the full picture on how long the application was actually stopped for. The log only reported ~24 seconds while in reality it was many minutes of time; unacceptable for any application which is expected to serve data in large quantities and low latencies.
Conclusion
Hopefully with this knowledge in-hand it will be easier to detect, identify, and respond promptly when an application begins to fail due to a JVM pause. The most helpful JVM flags to gather info are:
-XX:+PrintGCApplicationStoppedTime-XX:+PrintGCDetails-XX:+PrintSafepointStatistics-XX:PrintSafepointStatisticsCount=1-XX:+SafepointTimeout-XX:SafepointTimeoutDelay=<ms before timeout log is printed>
By analyzing the GC log and safepoint statistics together it is much easier to get a holistic view of how the JVM performs with respect to pause times. Usually, this information is enough to identify a cause or point in the right direction of a culprit.
Notes
-
There is a highly informative talk given by an Azul (previously Oracle JDK) engineer explaining the reasons, besides GC, that can pause the JVM. Much of the information in this post comes from that video. ↩ ↩2
-
This reference application containing all JVM options is very useful ↩
-
There is an additional flag which can may be of use:
-XX:+PrintGCApplicationConcurrentTime. ↩ -
There is another flag:
-XX:+PrintGCApplicationConcurrentTimethat will print the opposite; The time the application spends running between pauses, every time a pause occurs. ↩ -
These guys really thought ahead didn’t they? There’s also a
-XX:+TraceSafepointCleanupTimewhich gives more detail about time spent on cleanup operations during the safepoint. ↩